1:30min
Dr Joseph Sowka
OD FAAO Diplomate
Nova Southeastern University
College of Optometry
Ft. Lauderdale, FL, USA
Diagnosing and managing patients with glaucoma can be a challenging task.
Glaucoma can be diagnosed by observations of characteristic changes in the optic disc and retinal nerve fibre layer (RNFL), abnormalities in threshold perimetry, alterations in structure demonstrated on optical coherence tomography (OCT) and assessment of risk factors such as intraocular pressure (IOP) and family history of the disease.1 Therapeutic intervention is generally straightforward; that is, reduction of IOP with medicines, lasers and/or surgery. However, errors in diagnosis and therapeutics can make glaucoma management an arduous task. Take care not to make these common errors
Mistake #1: Not recognising when the OCT is wrong
There are several issues in imaging that make OCT assessments for glaucoma very suspect and even misleading. A relatively limited normative database (against which the patient’s measurements are compared), signal quality, blinks and saccades, segmentation errors, media opacities and an abnormal axial length can all contribute to induced false measurements on an OCT.
When interpreting an OCT printout, ensure that the quality score (as indicated for each specific proprietary device) has been met at a minimum. Look to see that there is proper illumination and clarity of focus and the optic disc image is properly centred with no missing data. Inspect the scan for signs of eye movement. Look to see how the device has segmented the individual layers to ensure that no artificial errors have been introduced. Posterior vitreous detachments and other vitreal issues may confuse the device and make it seem that it is measuring tissue that isn’t really there. Finally, if using any macular scans or ganglion cell analysis measurements, ensure that there is no concurrent macular disease. If there is, then do not use this potentially misleading information.2-4 (Figures 1 and 2.)
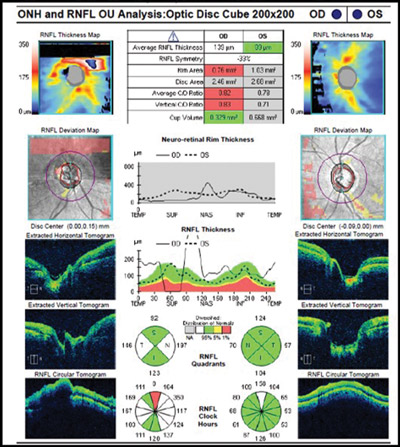
Figure 1. Abnormal OCT due to missing data from blink. Note how the RNFL thickness superiorly drops to ‘0.’ This never happens anatomically and is a result of the missing data rather than true glaucomatous loss.
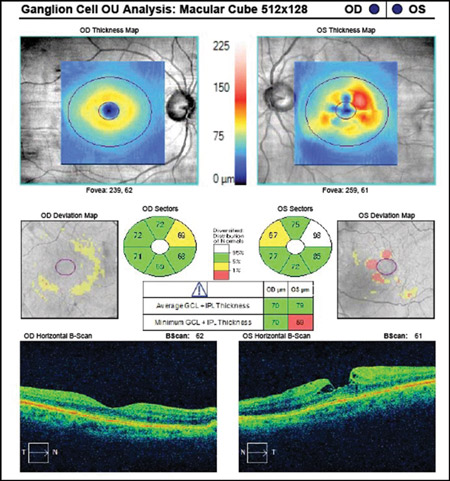
Figure 2. Abnormal ganglion cell analysis OS due to epiretinal membrane and macular pseudo-hole. Such images of concurrent disease should not be used in glaucoma analyses.
Mistake #2: Treating ‘red disease’
Most OCT printouts colour-code results as to degree of statistical significance. Common coding uses green to connote the patient’s measured data to be within 95 per cent confidence intervals, red to indicate when findings would occur normally in just one per cent of the population, and yellow to indicate all intervening values with borderline significance. In that each OCT manufacturer employs a relatively limited normative database to compare against, there commonly will be situations where a patient’s measured data falls outside the device’s normative database, yet the patient may be completely healthy and normal. Just because a patient’s measured information falls outside the 99 per cent level doesn’t mean that there is disease present. In this instance, much of the printout will be coded as abnormal in red, yet there is truly no disease present. This is commonly referred to as ‘red disease.’5
The use and overemphasis of imaging technology to the exclusion of additional clinical findings and assessment of risk will put patients in peril. All imaging technology must be interpreted in context with other clinical findings and when the OCT results do not fit with known correlates of glaucoma, the results should be interpreted with caution (Figure 3).
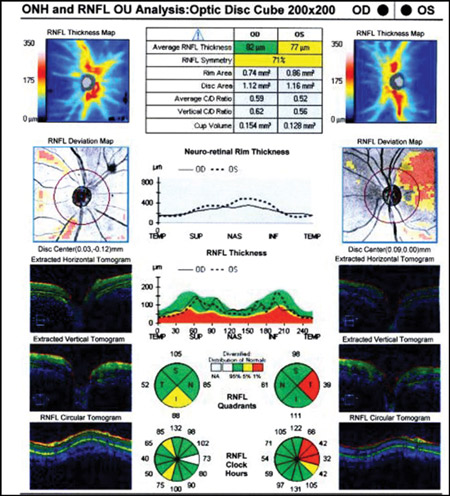
Figure 3. Left superior temporal OCT abnormality in an eye with a robust OCT thickness map, normal visual field, and ophthalmoscopically normal optic disc and RNFL as an example of ‘red disease’
Mistake #3: Not treating ‘real disease’
Similar to red disease discussed above, there may be instances where patient data may fall within the OCT normative confidence interval with results printed in green, yet have clinically, ophthalmoscopically visible damage to the RNFL and functional loss on threshold perimetry.6 This commonly occurs when inspecting the quadrant and clock hour graphs on OCT. When the RNFL analysis is divided into four quadrants or 12 clock hours, it must be remembered that considerable area is being averaged to give these sector values. A focal RNFL defect may be present ophthalmoscopically, but when averaged in with adjacent healthy tissue on OCT, the value may fall within the device’s normative database. Thus, everything is printed in green, giving a false sense of security in an eye that truly has structural damage. Thus, it is important to weigh the OCT results against the optic disc photographs and clinical examination to ensure that “green disease” is not missed7 (Figures 4A – B).
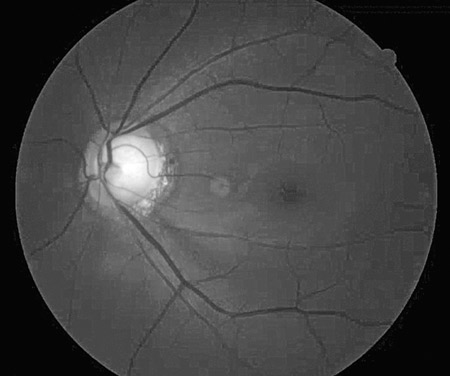
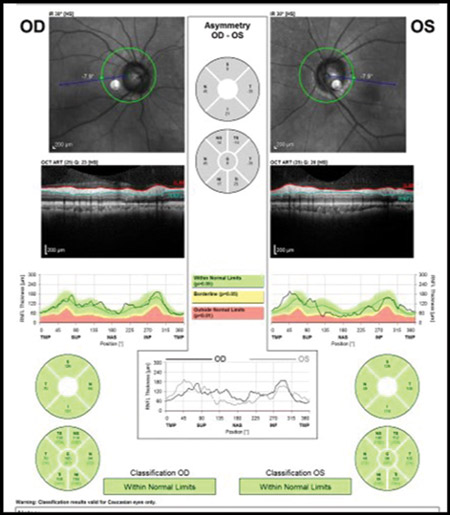
Figures 4. A: An ophthalmoscopically visible RNFL defect. B: A normal OCT with all data falling within the device’s normative database in a classic example of ‘green disease.’
Mistake #4: Changing therapy based upon one bad IOP reading or one changed visual field
Intraocular pressure measurements and visual field results can be variable, especially when one considers patient compliance with medications and the psychophysical responses in threshold perimetry. Patients often overstate adherence to medical therapy. Even when not trying to be intentionally misleading, many patients may not correctly remember if they used their medication properly immediately before the examination. Medicines don’t fail overnight. A medically adherent patient will not have an IOP of 15 mmHg on one visit and 30 mmHg on the next visit due to medicine failure or progressing trabecular dysfunction.
There will be a slow, progressive upward drift of IOP in cases where medicines are failing to control IOP. Always insist at least two IOP readings above target (and preferably three) before making any therapeutic changes. Similarly, visual field changes occur frequently, but shouldn’t be considered progression unless the change is verified in a subsequent (and preferably two) visual fields. Over 80 per cent of abnormal visual fields noted in the Ocular Hypertension Treatment Study were not verified on repeat testing.8 Always look for a sustained decrease in visual field results before changing therapy.
Mistake #5: Not getting enough pre-treatment… and post-treatment IOPs
Unless a patient presents with very high IOP (above 45 mmHg) or has advanced disease (with loss of central visual acuity or relative afferent pupil defect in an eye), there is generally no need to rush to treat chronic open angle glaucoma. It is very beneficial to get several IOP readings (at least two and preferably three) before initiating treatment of any kind. At one visit, the patient may be exhibiting a peak IOP or a trough reading. Knowing the range is very important.9 Similarly, one should never prematurely judge efficacy of treatment based upon the IOP reading immediately after initiation of therapy.
Even if the first IOP measurement after initiating therapy isn’t impressively lowered, consider leaving therapy unchanged and check at least one more time before deciding if a medication is truly efficacious or not. In the example here, there was an abrupt IOP drop after the initiation of therapy. However, it is notable that there are several pre-treatment IOPs that are nearly identical to the post-treatment IOPs, indicating that the prescribed medication, while overall effective, doesn’t consistently give the robust pressure reduction initially seen (Figure 5).
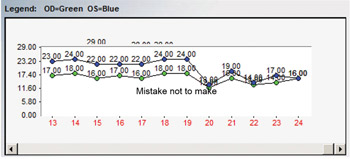
Figure 5. IOP curve before and after treatment initiation for glaucoma. Several pre-treatment IOPs were nearly identical to post-treatment IOPs, raising questions about the effectiveness of the chosen therapy.
Mistake #6: Not recognising a neurologic visual field in a glaucoma patient
One of the most insidious situations in eye care occurs when a patient with glaucoma manifests a neurologic disease concurrently. While glaucoma causes arcuate visual field defects that respect the horizontal meridian and neurologic conditions cause hemianopic defects that respect the vertical meridian, such patterns can get lost within the same patient. There are two ways to discern these differences. First, a glaucomatous visual field can be predicted by the optic disc and RNFL appearance. When the field loss is greater than expected and, often in an area not anticipated based upon the optic disc appearance, one should look for the neurogenicity by examining carefully both visual fields. Additionally, the greyscale printout is exceptional at identifying visual field defects which respect the vertical meridian while the pattern deviation can be quite poor. Further, while glaucomatous and neurologic damage can occupy the same quadrant, neurological defects may actually manifest a deeper scotoma within a glaucomatous defect.
CASE REPORT
A 74-year-old female previously diagnosed with glaucoma had optic nerve and RNFL damage consistent with glaucoma. However, observation of the grey scale showed bitemporal visual field defects that respected the vertical meridian. The fields were repeated and the pattern persisted. Ultimately, she was diagnosed with a pituitary macroadenoma and scheduled for neurosurgical intervention (Figure 6).
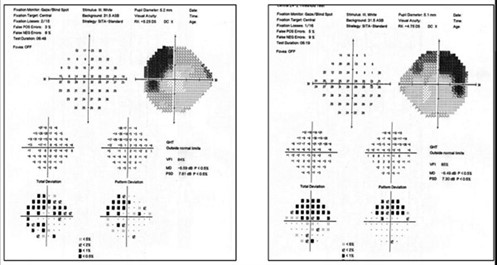
Figure 6. Superior bitemporal visual field defect in a patient with both glaucoma and pituitary macroadenoma. Note that the neurologic field is better appreciated on the grey scale than on the pattern deviation.
A second patient, a 65-year-old female also previously diagnosed with glaucoma exhibited bilateral inferior defects on visual fields. The left visual field matched extreme superior disc damage in that eye. In the right eye, her superior field defect matched optic disc and RNFL damage, but there was no structural abnormality to explain her inferior visual field loss. Most notable was the fact that the right inferior visual field defect stopped at the vertical meridian on the grey scale in the right eye. While the left eye had a significant inferior arcuate scotoma, it was notable that the left inferior nasal defect was absolute and much deeper than the remainder of the field loss. This led to the observation that she had not only glaucomatous arcuate visual field defects, but also a superimposed right inferior quadrantanopia. Subsequent neuroimaging revealed an ischemic cerebral infarct (Figure 7).
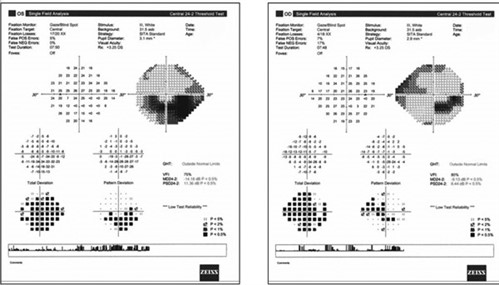
Figure 7. Right inferior quadrant defect hidden beneath the glaucomatous losses. Note that the neurologic field is better appreciated on the grey scale than on the pattern deviation.
Glaucoma diagnosis and management can be quite challenging. It is important to be aware that there are common errors that can make glaucoma management much more challenging.
1. Ahmad SS. Glaucoma suspects: A practical approach. Taiwan J Ophthalmol 2018; 8: 74-81.
2. Suwan Y, Rettig S, Park SC et al. Effects of Circumpapillary Retinal Nerve Fiber Layer Segmentation Error Correction on Glaucoma Diagnosis in Myopic Eyes. J Glaucoma 2018; 27: 971-975.
3. Giani A, Cigada M, Esmaili DD et al. Artifacts in automatic retinal segmentation using different optical coherence tomography instruments. Retina 2010; 30: 607-616.
4. Miki A, Kumoi M, Usui S et al. Prevalence and Associated Factors of Segmentation Errors in the Peripapillary Retinal Nerve Fiber Layer and Macular Ganglion Cell Complex in Spectral-domain Optical Coherence Tomography Images. J Glaucoma 2017; 26: 995-1000.
5. Chong GT, Lee RK. Glaucoma versus red disease: imaging and glaucoma diagnosis. Curr Opin Ophthalmol 2012; 23: 79-88.
6. Hwang YH, Kim YY, Kim HK et al. Agreement of retinal nerve fiber layer defect location between red-free fundus photography and cirrus HD-OCT maps. Curr Eye Res 2014; 39: 1099-1105.
7. Sayed MS, Margolis M, Lee RK. Green disease in optical coherence tomography diagnosis of glaucoma. Curr Opin Ophthalmol 2017; 28: 139-153.
8. Keltner JL, Johnson CA, Quigg JM et al. Confirmation of visual field abnormalities in the Ocular Hypertension Treatment Study. Ocular Hypertension Treatment Study Group. Arch Ophthalmol 2000; 118: 1187-1194.
9. Durairaj C. Optimal sampling scheme for estimation of intraocular pressure diurnal curves in glaucoma trials. Clin Pharmacokinet 2015; 54: 95-105.
Tagged as: Glaucoma, Patient management